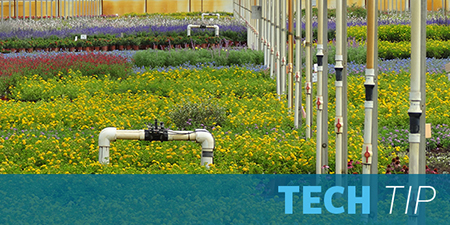
Irrigation systems apply a specific amount of water over a defined area. A well-designed system will have a precise application rate tailored to a field's soil and crop.
One of the key factors that affect application rates is sprinkler efficiency.
Sprinklers are designed to operate within a range of flows and pressures. If they operate outside these parameters, their distribution patterns and application rates will be altered, causing over or under-watering.
This can also cause uneven fertilizer and chemical application through the system. As a result, crop growth will be affected and yields will be lowered.
Pressure and flow rate relationship
An efficient irrigation system starts with the correct pressure. Make sure you use pressure regulators in strategic areas of your system design, such as laterals and/or in conjunction with a zone valve. This will help control pressure on a per zone basis. You can also install pressure regulators below each sprinkler.
Keep in mind that all it takes is a ~20% pressure change to create a ~10% flow variation. The lower a sprinkler's design pressure is, the more critical it is to control pressure in order to maintain its design flow rate.
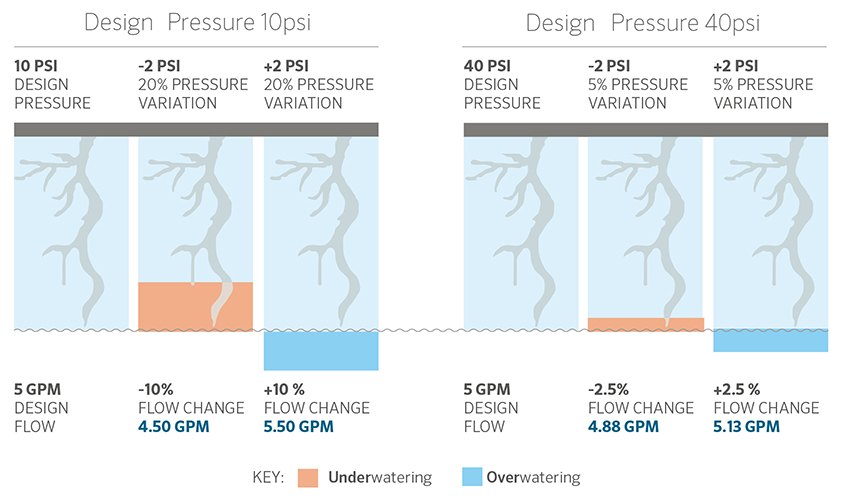
For example, a pressure variation of 2 psi (0.14 bar) on a sprinkler designed to operate at 10 psi (0.69 bar) is equivalent to a 20% pressure variation. This alters the flow by 10%.
Likewise, a sprinkler designed to operate at 5 gpm (1136 l/h) will have 0.5 gpm (113 l/h) variation; delivering 4.5 gpm (1022 l/h) if the pressure decreases and 5.5 gpm (1249 l/h) if the pressure increases.
However, on an sprinkler designed to operate at 40 psi (2.76 bar), the same 2 psi (0.14 bar) variation will only result in a 5% pressure variation.
In this case, the fluctuation in flow will be equivalent to a 2.5% change, which is less than a tenth of a gallon per minute. Thus, the flow will oscillate between 4.88 (1108 l/h) and 5.13 gpm (1165 l/h).
The following table shows pressure changes and percentage of flow variations in further detail:

Check out our Pressure Regulator Comparison table and ensure the pressure and flow rate relationship works harmoniously in your irrigation system.
Additionally, please remember to download our SennREG™ app. It is a handy tool to bring into the field when checking your pressure regulator’s performance. With just a few taps, you’ll know what to expect out of your irrigation pressure regulator at different flows and vice versa.